DiscoverDEM

The perfect way to learn about Digital Elevation Models

Arrow

What is a DEM

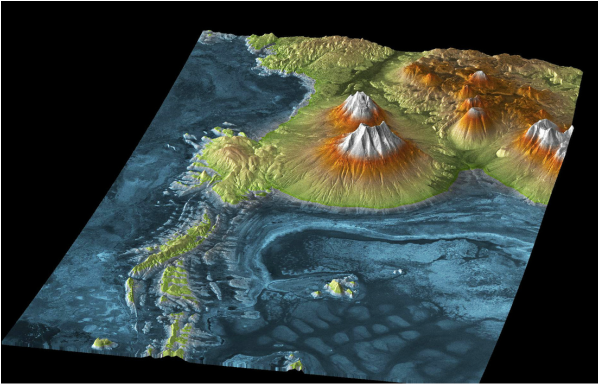
A digital elevation model (DEM) is a digital model or 3D representation of a terrain's surface — commonly for a planet (including Earth), moon, or asteroid — created from terrain elevation data.

Types of DEM

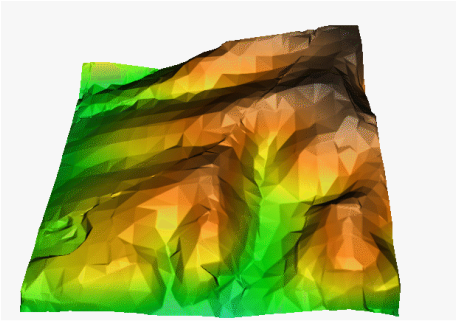
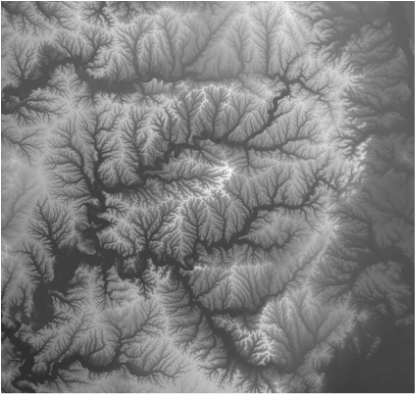
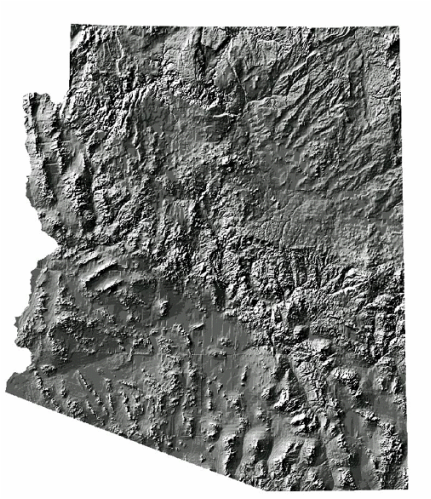
A DEM can be represented as a raster (a grid of squares, also known as a heightmap when representing elevation) or as a vector-based triangular irregular network (TIN). Raster typed models are used more frequently, though vector models are significantly smaller in size and easier to render.

Modern Uses

In todays world we see a lot of uses of DEM models. Some of the most familiar uses are actually already on most smart mobile devices. When looking at applications like Apple Maps, Google Maps, Google Earth, and Bing, the 3D terrain and buildings are examples of using DEM models and information to render them 3D. Without this data, all of the applications maps would be solely flat with no 3D modeling.

Here is an example of a TIN (triangular irregular network). This is an example of a DEM. Its strengths is that it is easier to render in software, it is very small is size compared to a Raster based DEM, and uses only polygons to represent the surface.
This is an example of a Raster Based DEM model. As you can see, there is a significant amount of detail and data compared to the above TIN model. The reason is that Raster data is collected in a continuos motion by satellites using Light Detection And Ranging (LiDAR) onto the Earth and reading back the data and creating models such as this one. You get a lot of detail and can make out very small features. An issue with this is that these files tend to be very large, they are harder to render on slower devices, and are way more expensive to create.
This Model is a true Raster based DEM model. When these models are created, they originally look like this in Black and White. The Black is lower elevation and the White is higher elevation. It is up to the geographers to use special software and color code the different elevations to make them user friendly and easier to read.
Here is a nice DEM of the state of Arizona. The city of Phoenix is toward the lower center of the model. If looking closely you can see South Mountain. With little added information a DEM model can tell a lot of information. You can easily see where the more mountainous and higher elevation areas are on the map, where the valleys and plateaus are, and with a closer eye, where the rivers cross the terrain.